A study [1] published by researchers at the University of Pennsylvania in JAMA, the Journal of the American Psychiatric Medical Association (December 2022) and relayed throughout the French media indicates that “the suicide rate in women of childbearing age increases significantly when the access to abortion is restricted or abolished”. From the outset, the authors differ from the studies linking abortion to the negative consequences on the mental health of women (depression, attempted suicides). On the other hand, they base their research on an extension of the Turnaway study according to which women excluded from abortion, through exceeding the time limit, would be more highly stressed and more anxious than women who are able to abort. They claim to go even further by questioning the existence of any link between the legislations of the different American States concerning abortion or access to sexual and reproductive health and the suicide rates of women in the United States.
Based on the period 1974 to 2016, the authors thus analysed the suicide rates before and after the adoption of the regulations aimed at abortion clinics, and stated “a yearly suicide rate some 5.81 % higher than in the years preceding the introduction of such regulations”. Published in December 2022, this study [1, 2022] does not take into account the rescinding of the Roe vs Wade ruling by the American High Court on suicide rates in the Unites States.”
1-The American context
1-a) The American context on abortions
In the United States, the authorized time limit for abortions varies markedly from one State to another. According to the CDC (Center for Disease Control), half of abortions are conducted medicinally before 10 weeks’ pregnancy and half surgically, either by suction up to 13 weeks or by dilatation and evacuation beyond 13 weeks. Finally, again according to the CDC, 93% of abortions are conducted at up to 13 weeks’ pregnancy. Over 65,000 abortions are therefore performed after 13 weeks’ pregnancy.
In France, abortion is authorized at up to 14 weeks’ pregnancy. 76% of abortions are performed medicinally prior to 7 weeks’ pregnancy. The regulations are governed by the State: 65% of abortions are performed in hospitals, and 34% in the home, in health or family planning centres, or in general practice. In the United States, the regulations differ from one State to the next.
1-b) Which structures perform abortions in the United States?
According to the Kaiser Family Foundation, half of abortions are performed in specialist abortion clinics (53%) and the other half, in general health clinics and hospitals (46%), the remaining 1% being performed in doctors’ surgeries. In the United States, these clinics are essentially private, many of which belong to the American Family Planning Federation (Planned Parenthood) which lays claim to 374,155 abortions out of the 930,160 abortions performed during 2020 (according to the federation’s yearly report for 2021-22) (according to the Guttmacher Institute).
1-c) What are the regulations governing the conducting of abortions in the United States?
The study [1, 2022] focuses on the application of the regulations relative to the performing of abortions in clinics according to the State between 1973 and 2016. These so-called TRAP regulations (Targeted Regulation of Abortion Providers) have been described in an article by N. Austin and S. Harper at McGill University TRAP [2, 2019]. Depending on the State, clinics must comply with 3 types of regulations:
- Rules applicable habitually at walk-in surgeries,
- Specific access/admission rights at the closest hospitals
- Agreements on transfers to such hospitals in emergencies.
The authors of the article [2, 2019] consider that these 3 types of regulations are superfluous for the conducting of abortions in total safety. According to [2], these standards applied to abortion clinics may obstruct access, due to the induced cost and the difficulty in obtaining the rules for transfer to hospitals. This situation could therefore reduce the abortion rates according to certain studies quoted in [2, 2019]. By comparison, in France, they are mandatory for surgical abortions.
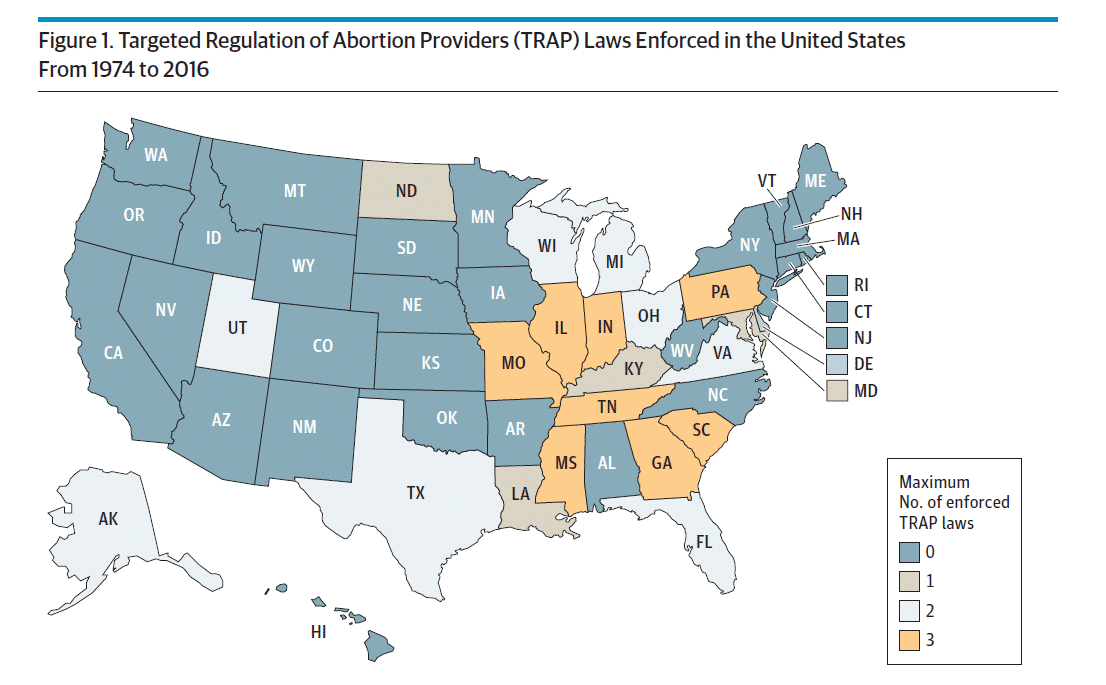
The authors of [1,2022] examine these different regulations in creating an indicator ranging from 0 (no regulations) to 3 (including all 3 types of regulations). The map of the United States (figure 1 below) shows these different levels of regulations.

2- Variation of the suicide rates for women of childbearing age before and after the introduction of regulations restricting access to abortion
2-a) The explanatory factors for suicides in the United States
In the United States, suicide is a major concern for public health since it accounts for some 46,000 deaths per year (https://www.cdc.gov/suicide/facts/index.html ) i.e. a national rate of 13.5 per 100,000 inhabitants in 2016 (slightly higher than the rate in France at 12.3 in 2017) with disparities between men (21/100,000 compared with 19.3 in France) and women (6/100,000 equal to the level in France).
According to the experts at the Center for Disease Control, the risk factors which can trigger suicide are multiple (https://www.cdc.gov/suicide/factors/index.html ): individual (depression, chronic suffering, financial difficulties, drug abuse, sexual abuse etc.), relational (harassment, family environment, isolation, violence etc.), community, ethnical or social.
2-b) A model elaborated on the basis of questionable variables
The explanation of suicides is therefore a difficult task which is dependent on numerous individual or collective factors. The authors of [1,2022] however elaborated an extremely simplified model in order to interpret the suicide rate per State and per year. In fact, they selected macro indicators only, which do not correspond at all with the factors identified by the CDC:
(1) the yearly GDP per State,
(2) the rate of unemployment per State,
(3) the proportion of Afro-Americans in the population of the State,
(4) the percentage of republican senators.
Apart from the impropriety of including republican senators as an explanatory factor for the suicide rate of women, the proportion of Afro-Americans in view of their ethnic differences, does not appear relevant either to the suicide rate (cf [3, 2021]). In fact, Afro-Americans are not distinguished from Hispanics or Asians since they all experience lower suicide rates than the national average constantly over time. Conversely, the white population is distinguished by a suicide rate which is significantly higher than the national average.
2-c) A model which provides unreliable results (margin for error and test groups)
According to the authors, the main result of the article [1, 2022] is as follows: “ The application of regulations targeting abortion clinics (Targeted Regulation Abortion Providers) has resulted in a 5.81% increase in the suicide rate for women of childbearing age compared with the years preceding the introduction of such regulations”.
The “difference in difference” method used is a method for comparing samples to evaluate the effects over time of a legislation. The limitations of this method have been described by Esther Duflo, holder of the Nobel prize for economy in 2019, in an article in 2004 [4].
The 5.81% increase results from a model, which like any other model, includes a margin of error on the estimation. Looking at the more detailed results of the model, the estimate of the yearly increase is in fact between 1.09% and 10.94% if one is looking for a 95% reliable result (statistically speaking, a 95% degree of confidence). The target figure is therefore afflicted with a high degree of uncertainty.
In order to reinforce their argument and achieve a study of some sensibility, the authors of [1] compare the suicide rate in the target group of women of childbearing age between 20 and 34 with two other control groups:
- the suicide rate among women aged 45 and over (who are therefore no longer at first sight of childbearing age)
- the rate of mortality of women of childbearing age, victims of motor vehicle crashes.
The authors applied their model to these other two indicators. A negative result could be expected: the TRAP regulations should not have any effect on the suicide rate of women who are no longer of childbearing age nor of women victims of motor vehicle crashes. However, when comparing the impact of the TRAP regulations on the suicide rates for women of childbearing age (TRAP law index between 0.03 and 0.32) with that for the other groups, it can be seen that the level of the TRAP law index is not without impact on the suicide of women aged 45 and over (between –0.11 and 0.24) nor even on the rate of mortality of women of childbearing age, victims of motor vehicle crashes (-0.04 to 0.11). This contradicts the statement accompanying the publication of the study: “[The researchers] conducted the same study for all women aged between 45 and 64 between 1974 and 2016. They found no effect”.

3- What do the descriptive data show?
3-a) Is there any link between the regulations governing abortion clinics and the suicide rate per State?
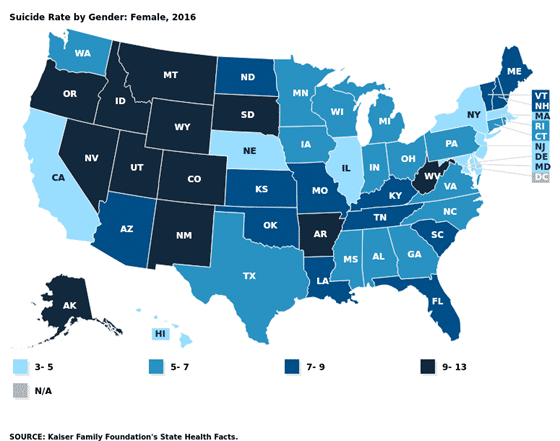
The suicide rate for women also varies markedly from one State to another:

According to the data compared on the maps and associated tables, there is no link between the suicide rate and the TRAP regulations in 2016. As mentioned by the CDC, among the States which apply no TRAP regulations, the suicide rate (related to 100,000 inhabitants) is higher in the rural States (Alaska,”12.7″, Wyoming,”11.2″, Utah,”10.8″, Nevada,”10.6″, Idaho,”10.3″, New Mexico,”9.8” etc.) than in the more populated urban States (California: ”5”, New York: ”4” etc.). Similarly, among the 8 States the most highly TRAP regulated, Illinois enjoys a very low suicide rate (5) whereas Missouri reaches 9.
The authors of [1] compare the suicide rate for women of childbearing age in the unregulated States (28 States with an average suicide rate of 5.5/100,000) with that observed in the States subject to at least one regulation (22 States with no precise mention of the associated rate in the article). However, if one compares the average of suicide rates for women of childbearing age in 2016, this rate is higher in the States with no TRAP regulations (7.27/100,000) than in the States with regulations (6.7/100,000). The same trend is visible for the years 2012-2016 with a suicide rate of 6.95/100,000 in the States without regulations compared with 6.21/100,000 in the States with regulations (11.9% difference). This tends to show that the explanation of the suicide rate lies within other variables than those chosen by the authors of the study.
3-b) Is there any link between the abortion clinic regulations and the abortion rates?
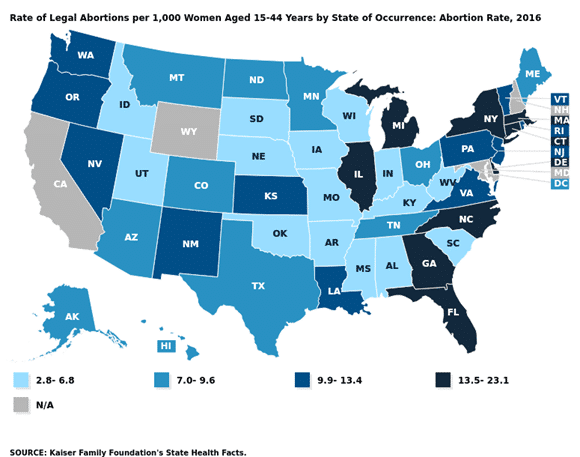
Finally, the study [2] suggests that the level of regulations should have a direct impact on the abortion rates per State. However, no link was visible when examining the abortion rates per State in 2016.

Very large differences are visible irrespective of the level of regulations. Thus, among the States where the regulations are least, South Dakota shows an abortion rate of 2.8 per 1,000 women compared with 23 abortions per 1,000 women in the State of New York. Similarly, among the 8 most highly regulated States (level 3), Illinois has an abortion rate of 15.5/1,000 compared with 4/1,000 in Missouri.
In conclusion
- This study shows its fundamental limits: The model elaborated proved ultra-simplistic. The variables on which it is based are questionable since the suicide rate is interpreted in relation to highly general indicators with no direct link to suicide. The experts on the subject agree however that the factors leading to suicide are both numerous and complex.
- The results of the model are unreliable. On the one hand the margin for error around the target figure (5.81% yearly increase in the suicide rate following the introduction of regulations) is very high. On the other hand, the application of the model to two test groups (suicide rate among women over the age of 45 years and the rate of mortality for women of childbearing age victims of motor vehicle crashes) proved inconclusive.
- The descriptive data shows that these regulations are linked to neither the suicide rate nor the rate of abortion.
Suicide and abortion are very serious subjects which demand the greatest rigour and deserve proper studies. The high suicide rates in the United States and in France demand consideration of the factors contributing to the carrying out of suicides. More generally, mental health is enjoying renewed attention. In October 2021, the WHO deplored the lack of means allocated to this question. In that context, it is important to study the impact of resorting to abortion on the mental health of women.
References:
[1] Zandberg J, Waller R, Visoki E, Barzilay R. Association Between State-Level Access to Reproductive Care and Suicide Rates Among Women of Reproductive Age in the United States. JAMA Psychiatry. 2023;80(2):127–134. doi:10.1001/jamapsychiatry.2022.4394 20221231-Psychiatry-Association-Between-State-Level-Access-to-Reproductive-Care-and-Suicide-Rates-Among-Women-of-Reproductive-Age-in-the-United-S.pdf [2] Austin N, Harper S. Constructing a longitudinal database of targeted regulation of abortion providers laws. Health Serv Res. 2019 Oct;54(5):1084-1089. doi: 10.1111/1475-6773.13185. Epub 2019 Jun 17. PMID: 31206632; PMCID: PMC6736922. [3] Ramchand R, Gordon JA, Pearson JL. Trends in Suicide Rates by Race and Ethnicity in the United States. JAMA Netw Open. 2021;4(5):e2111563. doi:10.1001/jamanetworkopen.2021.11563 [4] Bertrand, M., Duflo, E., & Mullainathan, S. (2004). How Much Should We Trust Differences-in-Differences Estimates? The Quarterly Journal of Economics, 119(1), 249–275. http://www.jstor.org/stable/25098683


